
6.1
ECONOMIC
DEVELOPMENT
Defining
Economic Development
Economic development is fundamentally about enhancing
the factors of productive capacity - land, labor, capital, and technology - of
a national, state or local economy. By using its resources and powers to reduce
the risks and costs which could prohibit investment, the public sector often
has been responsible for setting the stage for employment-generating investment
by the private sector.
The public sector generally seeks to increase incomes,
the number of jobs, and the productivity of resources in regions, states,
counties, cities, towns, and neighborhoods. Its tools and strategies have often
been effective in enhancing a community's:
·
labor force (workforce preparation,
accessibility, cost);
·
infrastructure (accessibility, capacity, and
service of basic utilities, as well as transportation and telecommunications);
·
business and community facilities (access,
capacity, and service to business incubators, industrial/technology/science
parks, schools/community colleges/universities, sports/tourist facilities);
·
environment (physical, psychological, cultural,
and entrepreneurial);
·
economic structure (composition); and
·
institutional
capacity (leadership, knowledge, skills) to support economic development and
growth.
However, there can be trade-offs between economic
development's goals of job creation and wealth generation. Increasing
productivity, for instance, may eliminate some types of jobs in the short-run.
There is lively debate within the field about the
differing goals for place-based development strategies and also about whether
place-based or people-based is best. Value differences, contending ideological positions, and varied theories of how economic development
occurs and how it should be practiced are presented in the following section.
Economic Development Theories
Economic development encompasses a wide range of
concerns. To most economists, economic development is an issue of more economic
growth. To many business leaders, economic development simply involves the wise
application of public policy that will increase U.S. competitiveness. To those
who think that government should more actively direct the economy, economic
development is a code phrase for industrial policy. To environmentalists, economic
development should be sustainable development that harmonizes natural and
social systems. To labor leaders, it is a vehicle for increasing wages,
benefits, basic education, and worker training. To community-based leaders and
professionals, economic development is a way to strengthen inner city and rural
economies in order to reduce poverty and inequality. To public officials at
state and local levels, economic development embodies the range of job creation
programs broadened since the 1980s in response to the decline of federal
domestic assistance.
Theories of economic development abound. Varying in
basic, fundamental ways, they make different behavioral assumptions, use
different concepts and categories, explain the development process differently,
and suggest different policies. The theories used by economic developers
determine, either explicitly or implicitly, how these developers understand
economic development, the questions they ask about the process, the information
they collect to analyze development, and the development strategies they
pursue. Ultimately, theoretical insights influence how successful economic
developers are in promoting local competitiveness.
To apply a theory successfully, the economic developer
must understand its language. The major theories of economic development are
each summarized in terms of five fundamental elements.
·
Basic
categories--the fundamental classification or distinctions used
to lay out the theory
·
Definition
of development--what economic development is or should be according
to the theory
·
Essential
dynamic--the key variable or relationship that drives the
logic of the theory
·
Strengths
and weaknesses--how well the theory enables one to understand
economic development
·
Applications--the
ways in which the theory can be used in economic development practice
Economic
Base Theory
The basic categories of economic base theory are the industrial sectors of the regional
economy assigned to either the basic sector or the non-basic sector. The
definition of local economic development is equivalent to the rate of local
economic growth measured in terms of changes in the local levels of output,
income, or employment. The essential dynamic of the theory is the response of
the basic sector to external demand for local exports, which, in turn,
stimulates local growth. The economic base multiplier transmits change in
output, income, and employment from the basic sector to the entire regional
economy. The theory's major strengths are: (1) its popularity as a basis for understanding
economic development in North America; and (2) its simplicity as a theory or
tool for prediction. Its major weakness is its in-adequacy as a theory for
understanding economic development, especially in the long term. Economic base
theory strongly supports attracting industry through recruitment and place
marketing.
Staple
Theory
Staple theory identifies industrial sectors as its basic categories. It defines
economic development as sustained growth over the long term. The essential
dynamic is the external investment in, and demand for, the export staple that
leads to the successful production and marketing of the export staple in world
markets. The theory's major strengths are its historical relevance to North
American economic development and its emphasis on understanding the region's
economic history. Its major weakness is that it describes, more than explains,
the development process. Staple theory provides a general strategy of
development by recognizing the connections of the economic base to the
political superstructure. Economic developers should continue to build on and
improve the export staple as long as it remains competitive in the larger
economic system. The idea is to "stick to one's knitting," since
strengthening the existing specialization may be more sensible than attempting
to diversify the economic base. Eventually, footloose economic activities (that
is, those not closely tied to specific
resources, inputs, or markets) will be attracted to the area if its market
achieves sufficient size or if it offers urbanization economies that can be
exploited by other exporters.
Sector
Theory
Sector theory uses three aggregate sectors as basic categories. The level of
development depends on sectoral diversity, emphasizing a prominent tertiary sector,
and labor productivity. The essential dynamic involves the income elasticity of
demand and labor productivity of primary and secondary sectors: as incomes
rise, the demand for income-elastic products grows; output increases as labor
released from primary and secondary sectors is employed in tertiary sectors.
Although sector theory is attractive because it can be applied and tested
empirically, the primary, secondary, and tertiary categories are too crude to
be useful in practice. The overriding application is the need to attend to
industries producing income-elastic commodities in order to achieve sustained
growth.
Growth
Pole Theory
Growth pole theory treats industries as the basic unit of analysis, one that
exists in an abstract economic space. Economic development is the structural
change caused by the growth of new propulsive industries. Propulsive industries
are the poles of growth, which represent the essential dynamic of the theory.
Growth poles first initiate, then diffuse,
development. Growth pole theory attempts to be a general theory of the
initiation and diffusion of development based on François Perroux's domination
effect. Although insights drawn from the theory are useful, it has failed as a
general theory of development. Growth center strategies are based on this
theory. Also summarized in the table are the growth theories of Gunnar Myrdal
and Albert Hirschman, which are consonant with Perroux's theory.
Neoclassical
Growth Theory
The basic categories of neoclassical growth theory are
sectors or regions that comprise the macro economy. Economic development is
defined as an increase in the rate of economic growth, measured in terms of
changes in output or income per capita. The theory has two essential dynamics.
One, in aggregate models, the rate of saving that supports investment and
capital formation drives the growth process. Two, in regional models, factor
prices--specifically, the relative returns on investment and relative wage
rates--stimulate factor flows that result in regional growth. Growth theory
suggests that economic developers respect the free market and do what is
necessary to support the efficient allocation of resources and the operation of
the price mechanism. The simplest growth models imply that economic developers
are unnecessary, but more complex formulations would support various economic
development activities.
Interregional
Trade Theory
The basic categories of interregional trade theory are
prices and quantities of commodities and factors of production, just as in microeconomics.
The implicit definition of development is economic growth that leads to greater
consumer welfare. The essential dynamic is the price mechanism (price-quantity
effects) operating to eliminate price differentials and establish equilibrium prices
(the terms of trade). The theory has two unique strengths. First, consumer
welfare (increases in aggregate consumption benefits), not job creation, is the
goal of development. Second, the price/cost-based theory is extremely precise,
yet its precision is achieved with numerous restrictive assumptions and largely
by ignoring the dynamics of development. Economists use growth theory and trade
theory to advocate less government intervention and freer international trade,
more open regions, and, in general, more competitive markets. The theories
provide strong support for local infrastructure development, improvement in
government efficiency, and other measures that could increase local
productivity and lower input costs for all producers. Local developers, on the
other hand, often ignore the implications of growth and trade theory and
instead support protectionist measures and growth strategies that do not always
improve the economic well-being of local consumers.
Product-Cycle
Theory
Product-cycle theory treats the developmental age of the product as its basic
category. Products are classified as new, mature, or standardized. At any point
in time, the space economy can be divided into regions where new products tend
to arise and regions devoted to the production of standardized commodities. The
essential dynamic of product-cycle theory is new product development, which is
one form of innovation. From locations where new product innovation takes
place, the product is eventually standardized and diffused to other locations
in the space economy. The process stimulates economic growth and development in
both types of locations, but the character of development is different in each.
These differences help explain why levels of development vary from place to
place, and why differences can persist. The economic developer who wants to
apply product-cycle theory in its most literal form must try to identify and
work with manufacturing companies that can create new products. Alternatively,
the developer may be able to mobilize the resources needed to improve the local
business infrastructure in ways that would support new product development.
Entrepreneurship
Theories
The basic category of economic development is the
entrepreneurial function as embodied in the entrepreneur. Development proceeds
as changes in firms and industries result in more resilient, diverse local
economies. The essential dynamic driving the development process is innovation.
Innovation is conceptualized variously in different theories as new combinations,
improvisation, or creative risk taking. To its credit, entrepreneurship theory
is mediated theory; people make development happen. This strength, however,
leads to the weakness that entrepreneurship theory is not easy to apply
consistently. The most general application is to support an industrial
environment or ecology favorable to entrepreneurs.
Flexible
Production Theories
Flexible production theories focus on production regimes and related methods of
industrial organization as basic categories. The regional development
implications of customized, batch, and long-run (or "Fordist")
production regimes--as well as outsourcing practices, supplier relations, and
processes of vertical integration and disintegration--are the principal concerns.
Development is not just quantitative growth but also qualitative change in
industrial mix, firm structure, and sources of competitiveness (for example,
from least-cost or price-focused competition to that based on innovation,
product differentiation, and niche marketing). More recent research has focused
on the impact of flexible production on labor practices, compensation, and
power relations between large and small firms. The key variable or relationship
(essential dynamic) that drives flexible production theories are changes in the
nature of demand that require firms to become more agile; standardized,
least-cost production is considered less and less viable as consumer tastes in
industrialized countries become more sophisticated and global competition
intensifies. Firms adapt to this new environment by adopting flexible
production technologies, managing supplier relationships, and utilizing
interfirm networks for information sharing and joint problem solving. Among the
principal strengths of the theory are a focus on rich, complex production
dynamics within firms, between firms, and between firms and labor. Weaknesses
are related to the strengths in that the focus on specific micro relations
means that implications for regional aggregates are often neglected. In terms
of application, the theory informs industry cluster strategies, buyer-supplier
networking initiatives, technology transfer programs, small-firm programs, and
some types of worker ownership and labor management policies applied at the
community level[i].
Economic
Development vs. Economic Growth
Economists Peter Bearse and Roger Vaughan write that:
·
Development is a qualitative change, which entails changes in the structure of the
economy, including innovations in institutions, behavior, and technology.
·
Growth is a quantitative
change in the scale of the economy - in terms of investment, output,
consumption, and income.
According to this view, economic development and
economic growth are not necessarily the same thing.
First, development is both a prerequisite to and a result of growth.
Development, moreover, is prior to growth in the sense that growth cannot
continue long without the sort of innovations and structural changes noted
above. But growth, in turn, will drive new changes in the economy, causing new
products and firms to be created as well as countless small incremental
innovations. Together, these advances allow an economy to increase its
productivity, thereby enabling the production of more outputs with fewer inputs
over the long haul. Environmental critics and sustainable development
advocates, furthermore, often point out that development does not have to imply
some types of growth. An economy, for instance, can be developing, but not growing
by certain indicators. Indeed, the measure of productivity should not be solely
monetary; it should also represent and shed light on how effectively scarce
natural resources are being used and how well pollution is being reduced or
prevented.
Definitions
That Address Equity and Sustainability
Economic development policymakers and practitioners
who are concerned about economically disadvantaged and depressed communities
highlight some different issues when they define economic development.
Community economic development or CED typically has five goals:
·
Stimulating a self-sustaining process of
economic development (the dynamic and rate of development);
·
Creating jobs at acceptable wages, with
appropriate benefits and career ladders for area residents (the distribution of
development);
·
Producing goods and services that meet social
needs, like affordable housing, lowered energy costs, better health care, and
accessible day care (the composition of development);
·
Establishing greater community control,
accountability, and participation in basic economic decisions such as hiring,
investment, and location (the control of development); and
·
Broadening business and asset ownership within
poor and ethnic minority communities.
The first objective is shared by other more
conventional economic and business development strategies. But the last four
distinguish community economic development from many traditional approaches and
are especially important for both low-income and working class communities. The
practice of CED also has a strong institution-building dimension, involving the
creation and strengthening of economic organizations controlled or owned by
residents of the area where these institutions are located. These might include
business firms, industrial parks, banks, credit unions, cooperatives, community
development corporations, and mutual housing associations. Lastly, there is an
implicit anti-poverty mission implied in this definition, given the goal of
creating more family-wage jobs.
The following economic development definition goes
further on issues of fairness, environmental compatibility, and quality of
life. The Corporation for Enterprise Development has argued that economic
development should help to achieve a more widely shared and sustainable quality
of life. This overall definition may be broken down into three elements:
·
Development
entails the enrichment of material, social well-being, which can be measured in
the flow of money and goods over time; increases in a jurisdiction's quality
and quantity of public goods (such as clean air and water, freedom from crime,
better schools, etc.); and access to good jobs (e.g., with wages and benefits
sufficient for supporting a family, and opportunities for advancement).
·
Shared
growth means there is broad distribution of opportunities for
meaningful participation in the economy and enjoyment of the benefits of an
increased standard of living.
·
Sustained
growth implies that the above goals are achieved in a manner
that does not detract from - but rather enhances - the economy's ability to
achieve the same goals in the future.
Obviously, this conception of economic development
adds to the debate about the means and ends of development policy. Many
economic developers see their job solely as one that concerns employment
generation and income growth. They believe that they have little influence on
other objectives and are not responsive to constituencies that are most
concerned with issues of equity and environmental conservation.
But an increasing number of voices contends
that economic development policies must pass the tests suggested by the last
few definitions: Are the policies, programs, and practices generating a higher
standard of living and more and better jobs? Are programs becoming more
accountable, cost-effective, and user-friendly? Are they expanding opportunities
for all Americans? And are they becoming more compatible with conserving our
environmental assets and promoting a higher quality of life?
Why
Is Economic Development Important
Economic development in the U.S. is a big deal. To
start, many argue that economic development is necessary for sustaining the
competitiveness of the United States economy and raising overall productivity
and incomes. Second, additional development can help maintain a high level of
employment and job quality for all Americans. Third, it can help to create the
jobs necessary for providing middle-class opportunities for the jobless and
working poor. Fourth, it can provide the earnings needed to make further
investments in education, government services, amenities, infrastructure, and
quality of life.
Moreover, economic development policy matters.
Federal, state, and local governments spend billions of dollars in its name.
So, development policy choices affect taxpayers' pocketbooks. What's more,
evidence suggests that many development programs actually work and do achieve
the goals listed above.
Economic development issues have a way of dominating
most policy debates in state legislatures and city councils. Its prominence is
due in part to citizens' tendency to evaluate public officials' success by how
well their state or local economy is faring. If jobs are being generated,
incomes are growing, and high profile companies are being attracted or
retained, then a politician's tenure is likely to be extended. If not, he or
she may become history.
But there is another important twist on the
significance of economic development. Almost every major state and local policy
debate, whether it involves taxation, welfare, environmental regulations, or
workforce healthy and safety, quickly becomes a debate over economic
development. Indeed, most new social and regulatory policies are fought on the
grounds that they will harm the area's business climate and cause private
investment to dry up. Similarly, education reform and adult retraining are
promoted for their potential impact on economic growth.
What
Do Economic Developers Do?
During the last thirty-plus years, the field of
economic development has changed significantly. Once an ad hoc art and
practice, it is gradually becoming more of a science, an industry and a
profession. Today, the field has its own journals and trade associations. It is
taught in universities and colleges. Certificates are awarded to those who
undergo appropriate training. Regional, national, and international conferences
are held from Frankfurt, Germany, to Raleigh, North Carolina.
Many lay people mistakenly believe that economic
development is simply a hands-on profession. The economic developer promotes
sites, visits existing industries, runs a revolving loan fund, and so forth.
But this is only the field's external face.
Economic development activities and outcomes are also
shaped by public policies. Funding for infrastructure, tax and regulatory
policies, new workforce training grants, and countless other examples influence
the environment for investment and commerce. Called "business
climate," this contested term refers to the extent to which the political
and policy environments of a particular state or locality, compared with other
jurisdictions, are seen to be supportive or burdensome to businesses. The
implication is that any area whose business climate is not
"competitive" will be shunned by the corporate sector and will find
it difficult to attract or grow new firms and the jobs they provide.
The business climate is affected by both major cost
factors (e.g., land, labor, taxes, regulations) and non-cost factors (e.g.,
quality of life, attitudes toward business). Government has a big impact on
business climate (and hence, economic development practice), for it is that
combination of services provided by the public sector, such as education,
infrastructure, taxation, and regulation, which creates the context within
which companies operate. Moreover, government delivers other direct programs to
companies in the form of grants, low interest loans, debt insurance mechanisms,
and business advisory services.
There is no complete roster of all who are involved in
this field, but here are some indicators of its size.
·
There are more than 2,000 community development
corporations (CDCs) operating in low-income areas throughout the U.S. These
groups boast 17 statewide associations and a national organization -- the
National Congress for Community Economic Development -- with over 800 members.
·
The state of Minnesota has 200 revolving loan
funds providing financing and management services to small businesses.
·
The American Economic Development Council, a
major national trade association, has nearly 3,000 members, as well as its own
research foundation that is affiliated with a major university.
·
The North Carolina Economic Development
Association has close to 650 members, with 200 of these based in local and
state organizations and agencies and another 400-plus engineers, attorneys,
consultants, businesspersons, bankers, and utility personnel. In fact, its
director estimates that 85 of the state's 100 counties have at least one
economic development staff person in place.
Once it was virtually synonymous with business
recruitment efforts; now it has broadened its boundaries. Today's economic
development involves initiatives ranging from improving local amenities (e.g.,
building a museum and aquarium) to reforming the K-12 educational system, from
retaining existing businesses to fostering minority ownership of business enterprises.
Indeed, a recent trade association publication that
surveyed economic developers found them in general agreement that:
·
The issue of educational quality and workforce
preparation will become increasingly critical.
·
Changes in information technology,
communications technology, and the growth of the Internet will have a major
impact on the profession.
·
Existing business development will be central
to economic developers in the years ahead.
·
Economic developers will have to know more
about global markets.
·
The ability to forge political consensus within
a community will be critical to successful economic development efforts.
·
Because of the scale of investments needed and
the speed of economic change, the New Economy places a premium on
collaboration. No one can afford to go it alone.
Yet, in many respects the challenge is the same.
Economic developers invest to build up their location and promote their assets
and opportunities to prospective investors, both inside and outside the
community.
THE 2000 ECONOMIC IMPACT OF EXPENDITURES BY TRAVELERS ON WISCONSIN
INTRODUCTION
This is the twelfth annual report of the economic
impact of traveler expenditures on Wisconsin prepared by Davidson-Peterson Associates. This report covers calendar
year 2000. The purpose of this study is to measure the economic
benefits derived by Wisconsin residents and governments from the dollars spent
in the area by travelers.
These economic benefits include:
·
Total
expenditures made by visitors;
·
Number of full-time
equivalent jobs supported by these expenditures;
·
Wages,
salaries and proprietary income earned by area residents;
and
·
State
and local government revenues generated.
The estimates of economic impact developed from these
procedures and analyzed in this report may be used to document the importance
of tourism as a key segment of Wisconsin’s economy, to underscore the need to
continue to support the expenditure of time, effort and dollars to promote
tourism growth, and to track the results of Wisconsin’s tourism marketing
efforts.
2000
ESTIMATED TRAVELER EXPENDITURES: $9,971,705,647
·
December - April $2,900,557,805
·
May - August $4,793,915,638
·
September - November $2,277,232,204
2000
ECONOMIC IMPACT (Annual)
·
Total jobs created (full-time job equivalents):
282,960
·
Total resident income (wages, salaries and
proprietary income) generated: $5,565,720,000
·
Total government revenues generated: State -
$894,986,000 Local - $647,979,000
2000 HIGHLIGHTS
|
Hotels/Motels/ |
Cabins/ |
Campgrounds |
|
|
Number of properties |
1,945 |
1,116 |
733 |
|
Number of rooms/units/sites |
76,492 |
9,282 |
58,380 |
|
Total available roomnights/ site-nights (millions) |
25.61 |
2.14 |
8.21 |
|
Total occupied roomnights/ site-nights (millions) |
15.66 |
1.21 |
3.56 |
|
Average occupancy rate |
61% |
56% |
43% |
|
Average double rate |
$81.80 |
|
|
|
Average unit rate |
|
$99.07 |
|
|
Average site rate |
|
|
$17.79 |
|
Management’s Estimate: |
|||
|
Average party size |
2.07 |
4.24 |
3.54 |
|
Average length of stay |
2.15 |
4.80 |
2.47 |
|
Guest Origin |
|||
|
Out of State |
50% |
53% |
38% |
|
U.S. |
47% |
53% |
38% |
|
Canada |
2% |
* |
* |
|
Other foreign |
1% |
* |
* |
|
Wisconsin |
50% |
47% |
62% |
|
Trip Purpose1 |
|||
|
Pleasure |
48% |
94% |
N/A |
|
Business |
36% |
5% |
N/A |
|
Meetings/conventions |
16% |
1% |
N/A |
Note: Length of stay as noted throughout this document represents the average number of nights spent in a hotel/motel/resort. It does not necessarily reflect the total number of nights spent in Wisconsin. Columns of figures may not add to totals shown due to rounding. * Less than 0.5%
WISCONSIN COMPARISON SUMMARY
1999 (Revised) vs. 2000
|
1999 (Revised) |
2000 |
Change |
|
|
Estimated Traveler Expenditures (billions) |
$9.081 |
$9.972 |
+9.8% |
|
Estimated Economic Impact: |
|||
|
Total full-time job equivalents supported |
258,138 |
282,960 |
+9.6% |
|
Total resident income (millions) |
$5,026.14 |
$5,565.72 |
+10.7% |
|
Total government revenues generated: |
|
|
|
|
State (millions) |
$848.78 |
$894.99 |
+5.4% |
|
Local (millions) |
$583.30 |
$647.98 |
+11.1 % |
WISCONSIN TOTAL ESTIMATED TRAVELER EXPENDITURES BY SEASON
1999 (Revised) vs. 2000
|
1999 (Revised) |
2000 |
% Change |
|
|
December - April |
$2,653,071,725 |
$2,900,557,805 |
+9.3% |
|
May - August |
$4,352,791,507 |
$4,793,915,638 |
+10.1% |
|
September - November |
$2,074,810,397 |
$2,277,232,204 |
+9.8% |
|
Total |
$9,080,673,629 |
$9,971,705,647 |
+9.8% |
THE
2000 ESTIMATES OF TRAVELER EXPENDITURES
By Accommodation Type
More than half of the total estimated traveler
expenditures, $5.66 billion (57%), were spent by
travelers staying in Wisconsin overnight at hotels/motels/resorts.
Those camping in Wisconsin spent $628 million (6%), and those staying in cabins/cottages/condominiums spent $513 million (5%) while traveling in Wisconsin.
Visitors with no lodging expenses spent 32% of
Wisconsin's 2000 traveler expenditures ($3.18 billion). Travelers who stayed at
the homes of family and/or friends spent $2.45 billion (25%) while visiting Wisconsin,
and those visiting just for the day or passing through Wisconsin spent nearly
$722 million (7%).
By Category of Expenditure
More than half of Wisconsin's total estimated travel
expenditures came from shopping and food expenditures ($3.0 billion and $2.4
billion, respectively).
Recreation expenditures represent 24% of traveler
expenditures ($2.4 billion), and lodging expenses represent 15% of the total
estimated traveler expenditures ($1.5 billion). Six percent of Wisconsin
traveler expenditures ($583 million) were spent on transportation.
Seasonal Differences in Traveler Expenditures
Half of all traveler expenditures in Wisconsin ($4.8 billion or 48%) were spent in the summer season (May through August). The winter season (December through April) represents 29% of Wisconsin's total traveler expenditures ($2.9 billion), and the fall season (September through November) accounts for 23% of these expenditures ($2.3 billion).
Fall and summer traveler expenditures increased by
10%, compared to 1999 (revised) while the winter season saw a 9% increase.
2000 County by County Traveler Expenditures and Economic Impact
|
COUNTY |
EXPENDITURES $ |
|
JOBS* |
RESIDENT INCOME $ |
STATE REVENUE $ |
LOCAL REVENUE $ |
|
|
|
|
|
|
|
|
|
|
|
|
2000 |
1999 REV. |
%CHG |
2000 |
2000 |
2000 |
2000 |
|
|
|
|
|
|
|
|
|
|
WAUSHARA |
38,864,172 |
37,741,696 |
2.97% |
1,078 |
22,578,102 |
3,028,852 |
2,772,798 |
|
|
|
|
|
|
|
|
|
|
WINNEBAGO |
175,617,133 |
161,444,525 |
8.78% |
4,881 |
102,246,543 |
13,716,368 |
12,556,813 |
|
|
|
|
|
|
|
|
|
|
OUTAGAMIE |
271,700,719 |
240,805,301 |
12.83% |
7,545 |
158,046,707 |
21,201,957 |
19,409,586 |
|
|
|
|
|
|
|
|
|
|
GREENLAKE |
48,331,419 |
45,410,143 |
6.43% |
1,340 |
28,061,354 |
3,764,429 |
3,446,192 |
|
|
|
|
|
|
|
|
|
|
WAUPACA |
69,250,226 |
67,331,924 |
2.85% |
2,135 |
28,342,000 |
6,300,000 |
3,433,000 |
Tourism Trends and Analysis: The Wisconsin Visitor
The majority of visitors to Wisconsin come from the
major markets of Chicago and Northern Illinois, Minnesota, predominately from
the Twin Cities, Iowa and a significant number from within Wisconsin. Because
of the state’s abundant variety of recreational opportunities, accommodations, attractions
and outstanding dining facilities, the tourism industry caters to a broad
spectrum of all travelers. Some 1996 visitor characteristics that are worth
noting include:
·
A
majority of visitors travel by auto.
·
There
is a somewhat increasing frequency of slightly younger travelers using
motorcoach, and an increase in males.
·
36%
visit friends and family.
·
About
93% of leisure travelers are strictly leisure and an additional 7% are on a
combination of business and leisure - a trend worth enhancing through
business/leisure promotion.
·
The
single largest category of recreational spending is food, followed closely by
shopping.
·
Satisfaction
rates among leisure travelers is high with over 90% stating they would
recommend a Wisconsin vacation to a friend or family member.
·
Aspects
most enjoyed were scenery and relaxation/getaway - Brand Image.
·
Over
90% of visitors indicate that they will return to Wisconsin for another
vacation in the next several years.
·
The
majority of the summer and fall vacationers are most likely to return in the
months of July through October - Cross-promote fall in summer and summer during
fall vacations.
·
About
½ of vacationers plan about 1 month prior to travel - the other 50% plan within
2-9 months.
·
Planning
is driven by availability of good weather and scheduling around travel groups
work and domestic schedules.
·
With
the aging of the Baby Boom generation, slightly more than 1/2 of our visitors
do not have children under 18 living in their homes. This trend is projected to
continue until 2010.
·
Summer
and fall vacation group make-up is about 35% families, 35% couples and 15%
friends.
·
Vacations
typically last from 2 - 4 days with the majority of that time spent in the same
area.
·
Most
important informational materials for "Planning" a trip are AAA
Trip-Tics, state maps and atlases and state and local publications and Internet
sites.
·
Areas
for Improvement: Better variety of food choices, availability of Indoor
activities to compensate for weather and better roads where needed.
Wisconsin Tourism Consumer Research
1994/95 Regionalizing Vals Research
1994 telephone survey of 5000 randomly selected consumers (in-state and out-state) who inquired about ten different areas of the state.
|
|
|
|
|
1. 69 percent of inquirers actually had vacationed in Wisconsin. |
||
|
2. Top ten destinations: |
|
|
|
|
1. Door County |
6. Eau Claire |
|
3. Length of stay: |
|
|
|
|
3-4 days |
|
|
4. Amount Spent: |
||
|
|
$325 average (per group - 3-4 people) |
|
|
5. Top Accommodations: |
|
|
|
|
Hotel/motel |
51% |
|
6. Top 10 activities: |
|
|
|
|
Dining |
92% |
|
7. Where they come from: |
|
|
|
|
In-state |
42.1% |
Before
any discussion of local economic development approaches and strategies can
occur, an understanding of regional workforce and economic conditions must
first be established.
The
Wisconsin Department of Workforce Development, Division of Workforce
Excellence, Bureau of Labor Market Information and Customer Services in its
December 2000, Winnebago County Workforce Profile notes:
·
Winnebago
County’s population has increased 10.3% between the 1990 census and the 1999
estimates. Winnebago County has grown faster than both Wisconsin and the United
States. This faster growth rate in Winnebago County is the result of more
people moving into the county than moving out of it. This pattern reflects a
positive net migration. Winnebago County’s population has also increased by
having more births than deaths. This component of population change is called
natural gain.
·
The
labor force is the sum of employed and unemployed persons who are 16 years old
and older. While Winnebago County’s population has increased by 10.3% since
1990, the labor force has increased by 6.2%. A larger portion of the resident
population is 16 and older. Consequently, a larger portion of the population is
now available for and in the labor force.
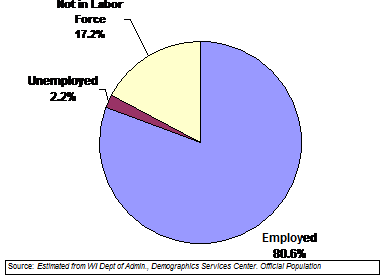
The term used to describe the relationship between the labor force and the population is the participation rate. Winnebago County has a somewhat larger participation rate than does the State of Wisconsin and the United States. Winnebago County’s labor force participation rate is 82.8%. The United State’s participation rate is 67.1%, while the state’s rate is 74.4%. Participation rates are often partly the result of economic conditions of an area and partly the result of demographic conditions of an area.
The 38.4 percent increase in labor force aged population between the ages of 40 and 54 is the result of the aging of baby-boomers. Of major significance to employers has been the negative growth in the number of younger workers. The decline in the number of 16 to 24 year olds and an increase in the number of businesses which traditionally hire large numbers of young workers has contributed to the current labor shortage.
|
Age Group |
1990 Census |
1999 Estimate |
Percent Change |
|
16-24 |
20,994 |
18,671 |
-11.1% |
|
25-39 |
35,553 |
36,212 |
1.9% |
|
40-54 |
23,393 |
32,369 |
38.4% |
|
55-64 |
11,689 |
13,216 |
13.1% |
|
65+ |
18,020 |
19,889 |
10.4% |
|
TOTAL |
109,649 |
120,357 |
9.8% |
Source:
Estimated from WI Dept. of Admin.,
Demographic Services Center. Official Population Projections 1990 – 2020.
In the past five years, the number of nonfarm jobs in
Winnebago County has increased from 75,037 to 82,496, an increase of 7,459. In
the same period, the number of people in Winnebago County who identify
themselves as employed has grown from 90,790 to 96,417, an increase of 5,672.
This divergence is chiefly due to the large number of outbound resident
commuters. Much of the cross- country travel is between the Fox Cities, which
are partly in Winnebago, Outagamie and Calumet Counties. Higher job growth
rates than the state and nation have consistently resulted in lower levels of
unemployment in Winnebago County than in the U.S. or Wisconsin.
|
|
|
|
|
|
|
|
Percent Change |
|
|
|
1993 |
1994 |
1995 |
1996 |
1997 |
1998 |
1 -
Year |
5 -
Year |
|
Total |
75,000 |
76,800 |
78,700 |
81,400 |
82,900 |
82,500 |
-0.5% |
9.9% |
|
Goods Producing |
32,000 |
31,900 |
32,500 |
33,400 |
33,700 |
34,200 |
1.5% |
6.9% |
|
Construction &
Mining |
2,740 |
2,970 |
2,990 |
3,230 |
3,500 |
3,530 |
0.8% |
28.7% |
|
Manufacturing |
29,200 |
29,000 |
29,500 |
30,200 |
30,200 |
30,600 |
1.6% |
4.9% |
|
Durable |
11,400 |
10,900 |
11,000 |
11,300 |
11,200 |
11,500 |
2.6% |
1.1% |
|
Nondurable |
17,800 |
18,100 |
18,500 |
18,900 |
18,900 |
19,100 |
0.9% |
7.3% |
|
Service Producing |
43,100 |
44,900 |
46,200 |
48,000 |
49,300 |
48,300 |
-1.9% |
12.2% |
|
Trans., Comm. &
Utilities |
2,650 |
2,890 |
3,060 |
3,050 |
3,260 |
3,090 |
-5.1% |
16.7% |
|
Total Trade |
14,300 |
14,800 |
14,700 |
15,300 |
15,700 |
14,700 |
-6.8% |
2.6% |
|
Wholesale |
2,200 |
2,330 |
2,360 |
2,710 |
2,820 |
2,710 |
-3.9% |
23.2% |
|
Retail |
12,100 |
12,400 |
12,300 |
12,600 |
12,900 |
12,000 |
-7.4% |
-1.1% |
|
Finance, Insurance
& Real Estate |
2,430 |
2,590 |
2,340 |
2,620 |
2,700 |
2,650 |
-1.7% |
9.3% |
|
Service |
14,900 |
15,700 |
16,800 |
17,600 |
17,900 |
18,100 |
1.1% |
21.1% |
|
Government |
8,800 |
9,000 |
9,300 |
9,400 |
9,700 |
9,800 |
1.5% |
12.0% |
Source: WI DWD,
BLMICS. Current Employment Statistics program.
Nonfarm wage and salary employment measurers
the number of jobs within a county excluding agriculture, military, and
self-employed workers. This data measurers the
number of jobs within the county without consideration of where the job-holder
lives. Thus, this information is often referred to as “place of work”
data. Winnebago County has a large number of residents who commute outside the
county to their jobs; this is the most significant reason why the labor force
in Winnebago County was 13,917 larger than the number of jobs within the county
during 19988.
Industrial parks and shopping malls adjacent to the
Highway 41 corridor have contributed strongly to job growth from one end of the
county to the other. Manufacturing industries, while not being the creators of
most job growth in the county, still account for 37.9% of the nonfarm jobs.
Service; transportation, communications, and utilities; and construction industries
have all demonstrated high percentages of job growth. That is consistant with
population and economic growth in Winnebago County.
WINNEBAGO
COUNTY EMPLOYMENT & EARNINGS 1998
|
|
Annual |
Percent of |
Percent Change |
Number of |
|
|
|
Average Wage |
State Average |
1 year |
5 year |
Workers |
|
All Industries |
$31,287 |
114.5% |
4.2% |
24.3% |
87,095 |
|
Ag. Forestry &
Fishing |
$16,887 |
86.2% |
8.3% |
13.1% |
429 |
|
Construction |
$36,654 |
109.2% |
5.9% |
26.0% |
3,620 |
|
Manufacturing |
$41,536 |
117.1% |
2.9% |
23.4% |
32,944 |
|
Trans. Comm &
Utilities |
$30,319 |
96.9% |
6.1% |
20.5% |
3,432 |
|
Wholesale Trade |
$31,956 |
92.4% |
1.3% |
21.0% |
2,961 |
|
Retail Trade |
$13,216 |
97.9% |
4.7% |
26.0% |
11,994 |
|
Finance, Insurance
& Real Estate |
$34,750 |
101.5% |
9.0% |
44.3% |
2,703 |
|
Services |
$23,640 |
100.4% |
3.8% |
22.6% |
18,858 |
|
Government |
$31,476 |
103.7% |
1.9% |
14.5% |
10,144 |
Source: WI DWD,
BLMICS. Employment, Wages & Taxes Due Covered by
Wisconsin’s U.C. Law, 1993 & 1998 Tables 209 -211
The greatest positive differential in average wages
between Winnebago County and statewide averages occurred within manufacturing.
Manufacturing annual wages in Winnebago County 1998 were 117.1 percent of the
state average. The primary reason for that difference is the predominance of
the paper industry and machine manufacturing industries with their high wages.
Manufacturing employment represents 37.8% of total
employment but 49.6% of wages paid in Winnebago County. Some of the
differential can be attributed to several large employers which have collective
bargaining agreements. Overtime wages also influence the total earnings of
manufacturing workers.
Retail trade employment represents 13.8% of
employment, yet only 6.1% of the wages paid in Winnebago County. The wages in
the retail industry represent a significantly smaller portion of total wages
than employment, because the industry employees a large number of entry-level
workers and over 40% of the employment is part time.
 Per Capita income is
total income divided by the total number of residents. Income includes wages
earned, dividends from investments, and transfer payments from the government.
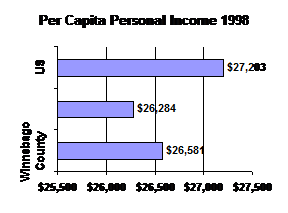
Winnebago County’s per capita income ranked 12th highest of
Wisconsin’s 72 counties during 1998. Per capita income in Winnebago County
during this period was 1.2% lower than the nations.
Per Capita income is
total income divided by the total number of residents. Income includes wages
earned, dividends from investments, and transfer payments from the government.
Winnebago County’s per capita income ranked 12th highest of
Wisconsin’s 72 counties during 1998. Per capita income in Winnebago County
during this period was 1.2% lower than the nations.
Over the past five years, Winnebago County per capita
income has increased by 26.5% and wages earned in Winnebago County have
increased by 24.3%. A probable reason for the larger increase in average
personal income than in per capita income is the large amount of Winnebago
County residents who work at jobs in the paper industry as well as technical
jobs and skilled trades. Skilled and technical worker wages have escalated as a
result of the tight labor supply.
Selected Occupational Wage Data
|
|
Mean |
Median |
|
Automotive Mechanic |
$12.17 |
$11.59 |
|
Cashier |
$7.51 |
$7.13 |
|
Computer Programmer |
$21.15 |
$19.26 |
|
Customer Service
Rep. |
$13.42 |
$12.57 |
|
General Office Clerk |
$9.66 |
$9.58 |
|
Industrial Truck
Operator |
$13.39 |
$13.47 |
|
Lawyer |
$31.74 |
$31.09 |
|
Machinist |
$13.96 |
$13.88 |
|
Mechanical Engineer |
$24.15 |
$22.94 |
|
Paper Goods Machine
Operator |
$12.90 |
$12.39 |
|
Registered Nurse |
$18.42 |
$18.11 |
|
Salesperson, Retail |
$9.13 |
$7.62 |
|
Secretary |
$10.82 |
$10.76 |
|
Teacher, Secondary
School |
$23.61 |
$24.70 |
|
Welder |
$15.38 |
$13.20 |
Source: DWD,
1998 OES Wage Survey Appleton/Oshkosh/Neenah MSA.
Wages paid for work within a county can impact the
type of goods and services which may be purchased. Examining wage structures
can be an important part of the hiring process for both job seekers and
employers. The mean wage is the sum of all wages divided by the number of wage
earners; this is often referred to as an “average”. The median wage is the
midpoint of all wages; there are exactly the same number
of wage earners above and below this wage. If the mean and median are
relatively close the labor market for that potential worker is probably tight
or very competitive. If the median is significantly below the mean, an employer
offering mean wages should capture most of the market. Manufacturing wages in
this county are higher than those of the state as a whole due to the larger
number of union workers[ii].
Within the State of Wisconsin and Winnebago County,
many economic development programs and professionals are already at work. At
the state level Forward Wisconsin, WiDOC, WHEDA, the SBA and WI Tourism work to
implement many of their programs by assisting local economic development
professionals, existing businesses and entrepreneurs.
Forward Wisconsin
Overview
Forward Wisconsin, Inc., (forwardWI.com) is a unique
public-private state marketing and business recruitment organization. Its job
is marketing outside Wisconsin to attract new businesses, jobs and increased
economic activity to the state. In July 2000, Forward Wisconsin created a new
division - Great Jobs Wisconsin - to recruit workers to Wisconsin from outside
the state. The Great Jobs Wisconsin program can be accessed at GreatJobsWI.com
Board
of Directors
Forward Wisconsin's Board of Directors reflects that
public-private partnership. Governor Scott McCallum is chairman of the board.
Private sector representation includes Wisconsin's utilities, banks,
educational institutions, investment firms, law firms, and manufacturers.
Public sector representation includes four state legislators and the Secretary
of the Department of Commerce.
History
Forward Wisconsin was created in 1984 on the
recommendation of a 1983 Marketing Task Force Report. It is a 501(c)(3) not-for-profit corporation.
Funding
Forward Wisconsin has an annual budget of
approximately $1 million. More than half of that funding is provided by private
sector contributors, with the balance coming from the state through a contract
with the Department of Commerce.
Marketing
Strategy
Forward Wisconsin works to boost the state’s image, to
project the state's positive business climate and to attract industry and
workers to Wisconsin. The group’s marketing plan focuses its resources on six
target industries and one primary back-up target. These industries currently
thrive in the state, are compatible with the state’s strengths and are
projected to have strong growth potential:
·
Computer & Data Processing Services
·
Plastics
·
Business Services
·
Forest Products (Hardwood Plywood)
·
Biotechnology
·
Production Machinery & Equipment
Primary Back-up Target:
·
Customer Service Centers
Marketing
Activities
Forward Wisconsin uses a wide range of economic
development marketing tools. These include:
·
Direct mail campaigns and follow-up
telemarketing to targeted industries and geographic areas.
·
Out-of-state prospecting trips
·
Trade show booth appearances at targeted
industry expositions
·
Print advertising campaigns directed toward
geographically targeted publications and target industry journals
·
Image-building campaigns
·
Special event promotion
·
Site selection and consultant education
Working
with Companies
Forward Wisconsin provides business cost comparisons,
financial information and a variety of other business consulting services to
prospective expanding businesses. Forward Wisconsin services are provided on a
confidential, no-cost basis.
Relationship
with the Department of Commerce
Forward Wisconsin gains its primary strength from its unique status as a public-private partnership, its ability to draw upon the resources of both the public and private sectors and its capacity to coordinate these efforts. The corporation’s success in implementing its mission statement depends in large part upon its close working relationship with the Wisconsin Department of Commerce. Forward Wisconsin is responsible for out-of-state marketing and business attraction, while the Department of Commerce is responsible for existing business retention, expansion, financial programs and international development.
Financial Resources for Businesses
The Wisconsin economic development team includes many
partners -- Forward Wisconsin, the Wisconsin Department of Commerce, other
state agencies, local economic development officials, the state's utilities,
the Wisconsin Technical College and University Systems, and other groups. Each
partner brings valuable resources to helping you with your expansion project.
Listed below are selected financial programs available through the Wisconsin Department of Commerce and the Department of Transportation that are most commonly utilized by out-of-state businesses expanding to Wisconsin. This is not an all-inclusive list of the financial programs available at the state level-- many local economic development groups and utility companies also have their own programs to assist your business expansion. Please contact Forward Wisconsin if you would like more information on financial assistance and incentives. We can put you in contact with the appropriate partner to get you the specific details you require.
The
Customized Labor Training Fund provides training grants to
businesses that are implementing new technology or production processes. The
program can provide up to 50 percent of the cost of customized training that is
not available from the Wisconsin Technical College System.
The
Community Development Block Grant (CDBG)-Economic Development Program,
funded through the federal Small Cities CDBG Program, provides grants to
communities to promote local job creation and retention. Local governments then
lend the funds to businesses for start-up, retention, and expansion projects
through grant funding. Funding levels depend on the number of jobs to be
created or retained.
The
Dairy 2020 Initiative awards grants and loans for business and
feasibility planning to dairy producers and processors considering a
modernization or expansion project.
The
Employee Ownership Assistance Loan Program can help a group of
employees purchase a business by providing individual awards up to $25,000 for
feasibility studies or professional assistance. The business under
consideration must have expressed its intent to downsize or close.
The
COMMERCE/DVR Job Creation Program is designed to increase
employment opportunities for DVR clients by providing equipment grants,
technical assistance grants, and customized assistance to companies that will
hire persons with disabilities as part of a business expansion.
The
Rural Economic Development Program makes individual awards up
to $30,000 for feasibility studies and other professional assistance to rural
businesses with fewer than 25 employees. Businesses that have completed their
feasibility evaluations are eligible for individual micro loans up to $25,000
for working capital and the purchase of equipment.
The
Major Economic Development Program offers low-interest loans
for business development projects that create a significant economic impact.
The
Technology Development Fund helps businesses finance Phase I product
development research. Firms completing Phase I projects can receive Phase II
product- commercialization funding.
Tax
Incremental Financing (TIF) helps cities in Wisconsin attract industrial
and commercial growth in underdeveloped and blighted areas. A city or village
can designate a specific area within its boundaries as a TIF district and
develop a plan to improve its property values. Taxes generated by the increased
property values pay for land acquisition or needed public works.
The
Enterprise Development Zone Program promotes a business
start-up or expansion on a particular site in any area of the state that
suffers from high unemployment, declining income and property values, and other
indicators of economic distress. The program offers tax credits for such
activities as hiring disadvantaged workers and undertaking environmental
remediation. Tax credits can be taken only on income generated by business activity
in the zone. The maximum amount of tax credits per zone is $3 million.
Industrial
Revenue Bonds (IRBs) are a means of financing the constructing and
equipping of manufacturing plants and a limited number of non-manufacturing
facilities. The municipality is not responsible for debt service on IRBs, nor
is it liable in the case of default. IRBs are also exempt from federal income
tax.
The
Wisconsin Transportation Facilities Economic Assistance and Development Program
funds transportation facilities improvements (road, rail, harbor, airport) that are part of an economic development project.
The Wisconsin Housing & Economic Development
Authority (WHEDA) currently operates under the following mission:
Mission
The Wisconsin Housing and Economic Development Authority serves Wisconsin residents and communities by working with others to provide creative financing resources and information to stimulate and preserve affordable housing, small business, and agribusiness.
It administers this mission through the following
programs:
Agricultural Products
Giving
Farm Families Credit
Preserving a Proud Tradition
![]()
CROP
Your production financing resource. CROP provides
guarantees for agricultural production loans. Visit our site for Farmers
and Lenders.
FARM
Is your operation ready for the 21st Century? FARM
provides guarantees for agricultural expansion and modernization loans. Visit
our site for Farmers and Lenders.
Beginning Farmer Bond
Isn't it time for your own operation? Beginning Farmer Bonds offer low interest
rates to beginning farmers.
Agribusiness Guarantee
The Agribusiness Guarantee helps small businesses develop new products using
Wisconsin's raw commodities.
Small Business Products
You want your small business to grow...
But do you have financing?
![]()
WHEDA Small Business Guarantee
The new way to grow your business. The WHEDA Small
Business Guarantee helps you acquire or expand your small business.
Linked Deposit Loan (LiDL) Subsidy
The LiDL Subsidy helps women- and minority-owned businesses by reducing the
interest rate on loans made by local lenders.
Agribusiness Guarantee
The Agribusiness Guarantee helps small businesses develop or expand production
of products using Wisconsin's raw commodities.
Homeownership Products
Homeownership Made Affordable,
and Easy, too.
![]()
HOME Loans
Offer a mortgage loan with a low, fixed interest rate to help low- and
moderate-income individuals and families buy a home.
Visit our sites designed just for:
- Homebuyers
- Lenders and Real Estate
Professionals
- Servicing Lenders
- Home Improvement Loan
Program (HILP)
Affordable home improvement loans of up to $15,000 are available to low-and moderate-income Wisconsin homeowners.
The Wisconsin Small Business Development Center assists Wisconsin businesses by:
About Us
- The
Wisconsin Small Business Development Center (WSBDC) exists to serve the
people of the State of Wisconsin. We do this by helping to ensure the
state's economic health and stability through formative business education
by counseling, technology and information transfer, and instruction. We
have served the people of the state primarily by developing and conveying
knowledge of small business activities. The Wisconsin SBDC has become well
known for its national leadership in this area. Today, our organization is
transforming itself to become a stronger force in the state's economic
development environment. We recognize the dramatic economic, social, and
technological changes that have unfolded globally and their impact on our
state and our small business community. The SBDC consists of the Lead
Center or State Office, which is administered by the unit of Business and
Manufacturing Extension at UW-Extension, and a network of service centers
located at 12 of the four-year UW institutions. We are a unique partnership
between the University of
Wisconsin-Extension and the business schools and
departments of the UW System.
Working together, we provide an array of programs, counseling, special
initiatives, research and publications. Business management education programs
are offered at an affordable fee. Counseling, to address individual
business needs, is available without cost to the small business client.
The SBDC program is funded by the U.S.
Small Business Administration, the State of Wisconsin, the University of Wisconsin-Extension,
economic development partners and user fees.
The Wisconsin Department of Tourism seeks to assist
Wisconsin communities through the execution of its mission and strategies.
Mission
Provide leadership and guidance to Wisconsin's tourism industry to ensure that tourism is a top contributor to the state's economy and quality of life.
Vision
Make Wisconsin the top travel destination in the Midwest.
![]()
Goals
1.) Deliver creative marketing
strategies that stimulate travel to and within Wisconsin.
Strategies:
A. Market Wisconsin as a premiere destination by
developing a consistent brand image for the state that focuses on the state's
four distinct seasons and diverse product.
B. Help maintain loyal customers, turn infrequent
visitors into more frequent visitors, and lure new visitors to the state
through enhanced targeted marketing efforts.
C. Expand niche marketing efforts to reach the
meetings and conventions, motorcoach, internationaland multi-cultural audiences
as well as the motion picture industry.
D. Continue researching our traveling customers to
take advantage of new trends and opportunities.
2.) Utilize the latest
technology to provide quality information and exceptional service to our
traveling customers and industry partners.
Strategies:
A. Strengthen information technology-based
partnerships and solutions with the Wisconsin tourism industry through such
tools as integrated customer and product databases and the Internet.
B. Proactively recruit and maintain a talented,
customer-friendly staff who possesses the knowledge
and skills to plan, deliver, and evaluate services to our customers in the
tourism industry.
C. Maintain an organizational structure focused on
diversity, integrated teamwork, cooperation and communication.
3.) Encourage the development
and growth of Wisconsin's tourism economy.
Strategies:
A. Provide technical assistance to tourism businesses
and organizations related to marketing, customer service, research
and product development.
B. Identify and promote additional offerings to
enhance Wisconsin's tourism product.
C. Continue to provide and identify financing options
designed to expand and/or enhance tourism in Wisconsin.
D. Deliver educational tools, research and training -
including the Governor's Conference on Tourism - to industry partners for
enhancing their competitive edge. Also, promote industry- sponsored educational
conferences and opportunities.
4.) Facilitate committed
partnerships with stakeholders to develop and grow Wisconsin tourism.
Strategies:
A. Strengthen existing and create new partnerships
within Wisconsin's tourism industry by continuing to conduct staff
familiarization tours, listening sessions and other approaches to actively seek
industry input.
B. Improve and develop partnerships with other state
agencies that share the same customers.
C. Create innovative methods to continuously
communicate with the tourism industry and other stakeholders about existing and
new programs.
D. Continue to seek the input and involvement of the
Governor's Council on Tourism and its subcommittees.
E. Expand joint effort marketing programs.
5.) Represent and advocate the
value of a vibrant tourism economy.
Strategies:
A. Facilitate dialog and information sharing between
the tourism industry and local, state and federal government representatives.
B. Identify and communicate tourism industry interests
to government decision-makers at all levels.
C. Identify and communicate pertinent legislative
issues to the tourism industry.
D. Maintain a positive image of Wisconsin tourism to
the general public.
E. Advocate for a stable and effective funding mechanism for the Department's promotional budget.
Specific Tourism program include:
·
Heritage Tourism
·
Joint effort marketing grant program
·
Consultant services
·
Marketing services
·
Wisconsin Travel information centers
·
Research
Locally, within Winnebago County, economic development
efforts have been undertaken by the county Industrial Development Board (IDB)
since 1966. The IDB is composed of eleven members who represent all the
communities within Winnebago County, the County Board and other municipal
organizations involved with economic development. Board members are appointed
by the county executive, subject to approval by the County Board. Each serves a
voluntary two year term. The Board’s annual budget is drawn from the general
fund of Winnebago County and subject to approval annually by the County Board.
The Board generally meets once per month.
The IDB supervises and administers three major
programs designed to achieve the key objectives of its mission:
“To financially assist communities in Winnebago
County to expand their tax base and to create jobs, as well as to promote
Winnebago County awareness regionally, nationally and internationally as a good
place to do business.”
Revolving Loan Program
In 1979, then County Executive Jim Coughlin initiated
County Board approval for the creation of a $1,000,000 revolving loan fund to
be administered by the IDB. The fund’s purpose is to provide low interest
“seed” money for communities in Winnebago County to develop industrial sites
and to assist local business in expanding their facilities.
Per Capita Funding Program
Originally established by the County Board in 1975, the Per Capita Funding Program was placed under the IDB’s administrative control in 1980. The fund provides direct financial support and promotion for local economic development programs. Money for the fund is determined and allocated by the County Board from general revenues received from the property and municipal taxes.
Recipients of funds from the program have been the
Village of Winneconne; the Cities of Oshkosh, Neenah, and Omro; and the Fox
Cities Chamber of Commerce on behalf of the City of Menasha and the Towns of
Neenah and Menasha. Other towns within the county have decided to allot their
per capita funds to nearby communities within the county that provide
employment opportunities for their residents. Since 1980, over $400,000 has
been distributed through the per capita funding program.
Marketing & Promotional Program
The purpose of the Marketing & Promotional Program
is to create awareness of the industrial development opportunities and benefits
of Winnebago County at the local, regional, national and international levels.
The IDB directly sponsors programs designed to achieve these goals, and
participates in cooperative programs with other local and regional economic
development organizations.
Within the Town of Rushford, economic development
wants to focus around three specific sub-sectors of the economy. These
sub-sectors are the agricultural economy, the tourist economy and the
commercial/retail economy. In addition to the need to focus on these three
economic sectors, the town also participates in industrial recruitment efforts
through its share of the local sales tax, as forwarded to the City of Omro for
use within the Winnebago County Industrial Development Board (IDB) program. A
local and regional framework must be applied by the town if it is to reach its
desired economic development goals.
Agricultural Economy
As outlined in the Agricultural, Cultural &
Natural Resource Element of this Comprehensive Plan, agriculture plays a major
role in the Town of Rushford. Current economic conditions within agriculture
illustrate that the family farm is occupying less of the market place while
larger, cooperate type, farms and smaller hobby and niche farms are gaining.
With a stated goal of protecting agriculture within its community the Town of
Rushford desires to assist the local farm economy by recruiting and supporting
agriculture and agricultural related businesses to its community. In addition
efforts to support the creation of new and local farm markets will be fully
endorsed by the town.
Commercial Business Economy
The Town of Rushford is speckled with numerous
independent “garage” type businesses. From farm equipment repair to sheet metal
working these local entrepreneurs represent Americas backbone of business
growth and development. While the town would like to encourage the start up and
operation of new and continuing “at home” businesses, it will need to carefully
monitor these operations as they develop and grow. Monitoring will be
undertaken to ensure that minimal land use and other potential conflicts do not
occur. In addition, monitoring will afford the town an opportunity to request
that businesses re-locate to appropriate use areas when they achieve sufficient
size to warrant.
In addition to home based businesses the town is also blessed with a number of onsite full-scale commercial operations. While currently somewhat scattered in their distribution the town is not at this time interested in the development of a business park. Using this approach, commercial business will be encouraged to be sited in or adjacent to either of the towns cross roads communities or advised to locate in an existing business park in a neighboring community.
Tourism Business economy
With a large natural resource base in public ownership
and amenities such as the Eureka Boat launch and the Rush Creek Nature Preserve
in Waukau, the Town of Rushford is poised to capitalize on the tourists which come to utilize these facilities. Several businesses
on “Main Street” Wuakau and “Main Street” Eureka take advantage of both local
expenditures and tourist expenditures. Maintaining and enhancing these
commercial retail corridors will greatly assist the town with capitalizing on
its tourism trade capture potential. In addition the proposed addition and
development of a commercial corner on the southwest corner of STH 91 in Waukau
will aid in the capture of travel related expenditures.
Another proposed commercial corner at the intersection
of STH 21 and County Road “E” will serve to supplement an existing general
store. In combination, each of these strategies will assist the town in
capturing tourism expenditures and assisting local residents by increasing the
availability of goods and services.
While strategies to allow for the construction and
operation of retail business establishments in the town are key
to the capture of tourism, tourism promotion is key to making the public aware
of the amenities and facilities that the town has to offer. Local efforts to
work with the Winnebago County Parks & Recreation Department for tourism
promotion and other groups such as the Oshkosh Convention & Visitors bureau
are critical to the town’s ability to recruit tourists. Additional
consideration should also be given towards the development of a regional
tourism promotion group that could develop and distribute marketing and
promotional materials on behalf of the town and its attractions.
Goals,
Objectives & Policies
Goal #1
To provide adequate land area for commercial developments needs within the town.
Objective:
Illustrate on the town’s future land use map sufficient area and a variety of
locations for potential commercial land use.
Objective:
Concentrate commercial land use areas in and around the crossroads communities
or Eureka and Waukau.
Objective:
Maintain concentrated commercial zoning on the “Main Street” corridors of
Eureka and Waukau.
Goal #2
Insure that commercial businesses are located properly
for their operations within the township.
Objective:
Monitor at home business operations to minimize land use conflicts and to
ensure relocation if warranted.
Objective:
Encourage perspective commercial businesses to locate in the Eureka or Waukau
area.
Objective:
Refer larger potential commercial or industrial businesses to adjoining
community business parks.
Goal #3
Encourage and participate in economic development efforts.
Objective:
Continue to support Industrial development efforts in the City of Omro through
the contribution of IDB program funds.
Objective:
Inquire with several c-store franchises about the feasibility of placing a
store in Eureka.
Objective:
Participate with local and regional groups and organizations in the promotion
of tourism based amenities.
Objective:
Work with county, state and federal agencies on property and facilities
management issues.